Equalization is generally considered a taboo in the audiophile world, with the general consensus in the community that it degrades sound quality and introduces noise, and the insistence that we should stay true to the actual sound reproduction of the HiFi setup.
In theory, equalization can introduce noise, especially if it’s a DSP equalizer based on FFT. However, this generally imperceptible “noise” (hardcore audiophiles may start insulting my aural acuity from hereon) is usually outweighed by far greater benefits that well-implemented, tasteful equalization brings.
While each headphone comes with an intrinsic factory-tuned sound signature, a quality pair of cans can usually be further tuned to achieve greater reproduction fidelity, sound neutrality, soundstage, instrument separation – things often believed to be immutable properties tied to physical driver design.
Disclaimer: I’m not claiming that any two equalized headphones can sound the same, or that you can make a cheap pair of headphones match a high-end one. There are still physical limits to what you can and cannot achieve. I’m just saying that certain properties are not as fixed or immutable as is often believed, and you can actually squeeze more performance out of your pair of cans.
Frequency Response
A headphone driver is nothing but an analog system that converts an input electrical current into output kinetic vibrations of a diaphragm, causing longitudinal compression waves to propagate through the air which our eardrums pick up as sound.
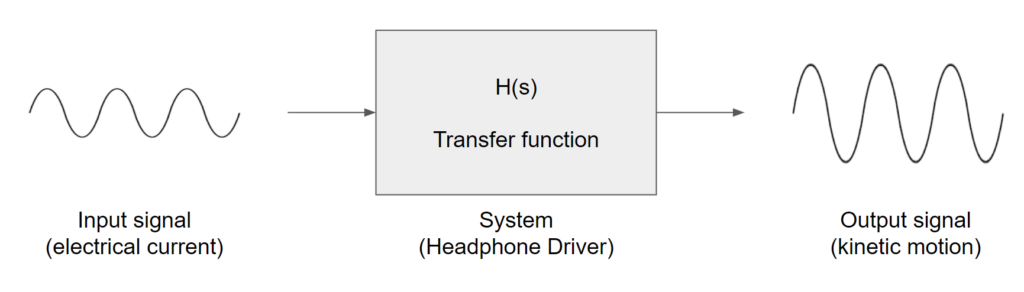
A system (as in signals and system) is usually mathematically described with a transfer function H(s), and it is commonly represented graphically as a frequency response diagram.
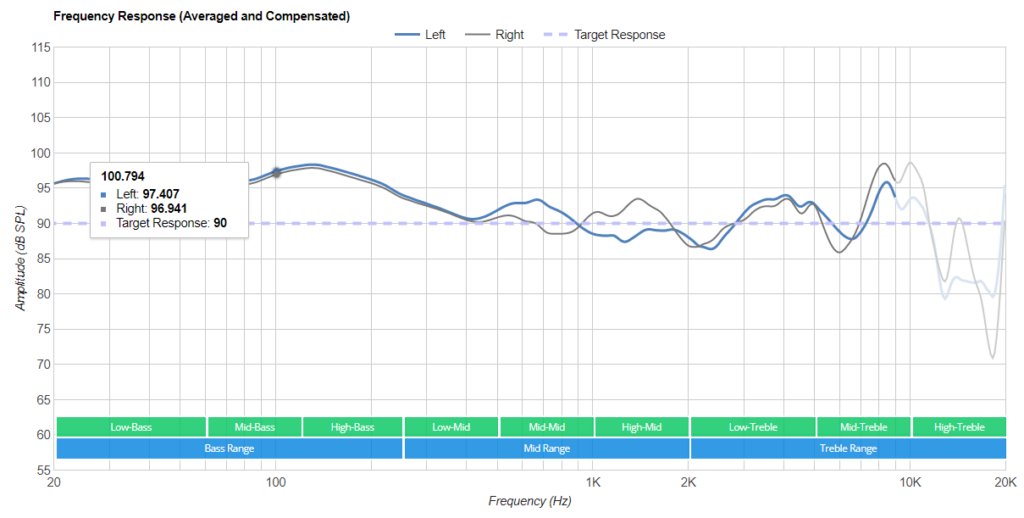
A system typically responds to each frequency differently. The frequency response diagram above shows amplification or attenuation of each input frequency, and can be mechanically obtained by sending an input frequency sweep of constant amplitude, while measuring the resulting sound pressure level through a measurement rig.
These are some common terms used to describe particular ranges of frequencies:
| Lows / Bass (<250Hz) – Kick drums, bass guitar, and other sounds that help add ambience. Mids (in between) – Main vocals, guitars, and other center-stage instruments, usually representing the bulk of the audio you hear. Highs / Treble (>2KHz) – Cymbals, flutes, and other sounds that help add detail to audio. |
A direct interpretation of the frequency response diagram is that an amplification or attenuation in any of the frequency ranges would directly impact the presence of sounds in the corresponding ranges.
However, it gets more complicated than that.
An overemphasis in bass coupled with under-emphasis in mids and highs may cause audio to sound “veiled” as if covered by an object. You can easily reason by thinking about what happens to your voice when you speak with a hand over your mouth – the bass passes through easily, but mids and highs are attenuated. On the other hand, having too much treble may cause sibilance (unpleasant emphasis of “s” sounds), and also listener fatigue.
Harman Target
We typically use sound signatures to summarize the general shape of a frequency response curve. Common ones include:
| Flat / neutral – No emphasis to any particular frequency. Colored – The opposite of being flat / neutral, with emphasis in several ranges. Analytical – Emphasis in treble, with “bright” being the more extreme case. Warm – Emphasis in bass, with “dark” being the more extreme case. V-shaped – Emphasis in bass and treble. A-shaped – Emphasis in mids. etc. |
Is there a certain sound signature that is most consistently perceived to be of a better sound quality / preferred by most trained listeners?
That is exactly what the study at Harman, The Relationship between Perception and Measurement of Headphone Sound Quality, by Sean Olive, aimed to unravel.
The result of the study is the Harman Curve, representing the sound signature with the highest probability of being preferred by an audio professional.
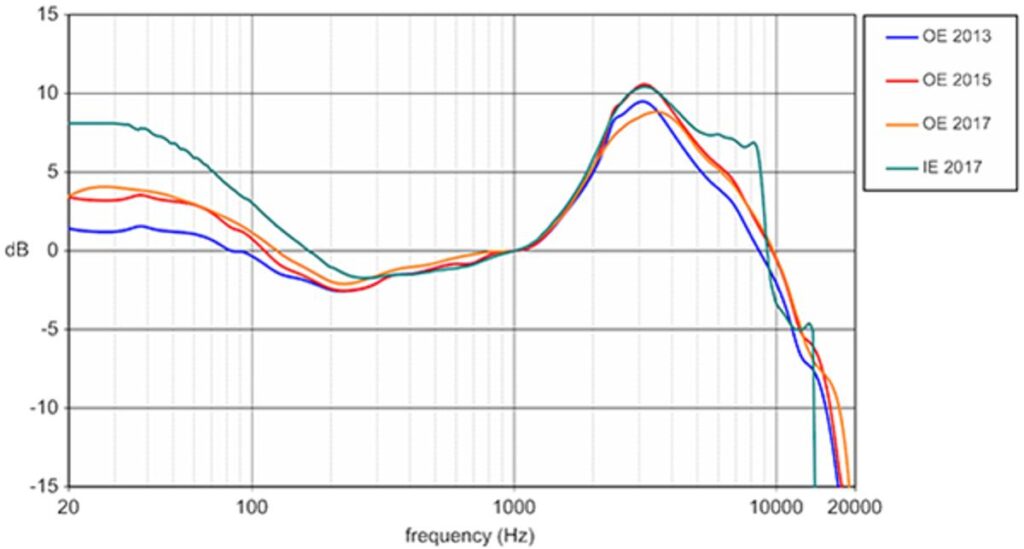
Almost a decade later today we have the Harman Curves (seven major variations as of today). You can find the most variations in the AutoEQ project (we’ll elaborate more on this later).
Surprisingly, audio professionals prefer a headphone sound signature that’s far from flat. It is said that this closely approximates what an actual flat loudspeaker would sound in a studio environment, thus it closely resembles what audio professionals were actually aiming for when mixing their tracks.
The result of the study became so impactful that headphone companies started manufacturing and marketing headphones targeted at the Harman Curve. This includes the well known AKG K371 and K361, and Samsung Galaxy Buds Plus.
Equalization
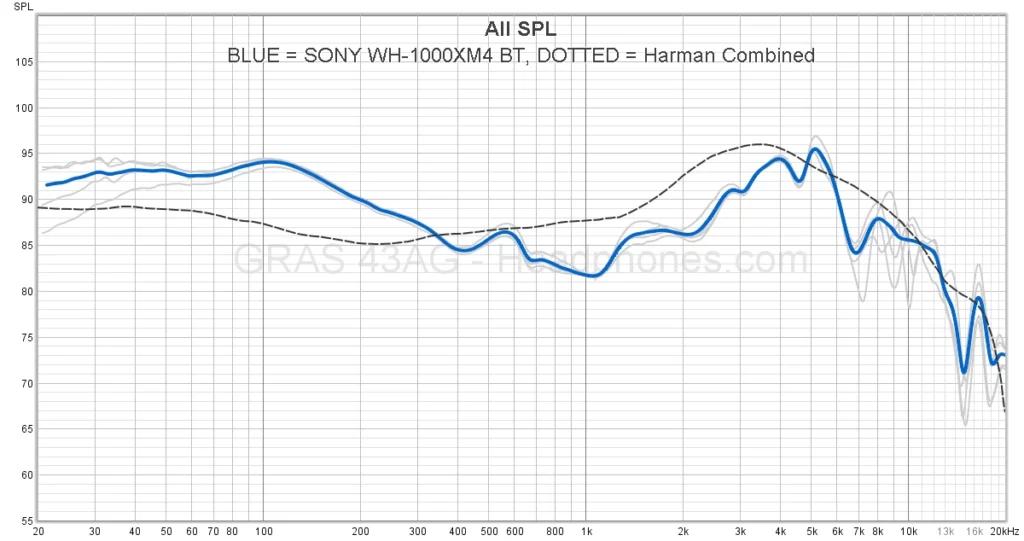
It is evident that the above pair of cans deviates quite a bit from the Harman curve. If you actually own a pair of XM4s, you may even describe the sound as dark or “veiled”.
But fret not, equalization to the rescue.
Equalization is a technique originally used to shape signals through a telephone line to ensure that the output at the other end is flat across all frequencies, and is thus “equalized”.
The concept was later applied to audio engineering use-cases like compensating for the uneven frequency response of the recording equipment to ensure faithful reproduction. In this context, the term “equalization” may no longer be accurate, given that a flat response might not be the final intent of its use.
The two most common user interface for an equalizer is the graphic (or fixed band) equalizer, and the parametric equalizer.
Since each slider of an equalizer amplifies or attenuates a its own range of frequencies, you can also think of them as frequency-specific volume controls.
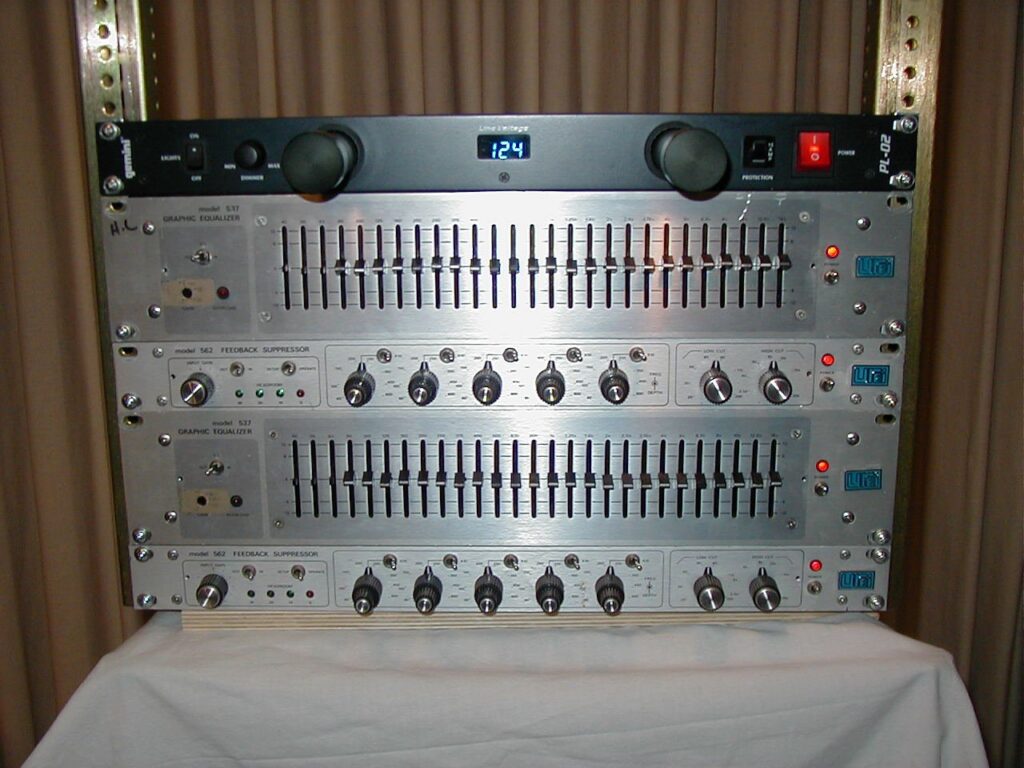
A graphic equalizer consists of sliders (or “faders”) for an evenly spaced fixed set of bands, e.g. 31hz, 62hz, 125hz, 250hz… 16000Hz (evenly spaced in the logarithmic sense), allowing the user to define the gain for each.
#/media/File:Equaliser-section.jpg)
On the other hand, a parametric equalizer not only allows the user to define the gain, but also the central frequency of each EQ band, and usually also the Q factor (Quality factor) which determines its bandwidth.
Evidently, the graphic equalizer may be way friendlier but it’s less precise than a parametric one.
Equalization can very easily cause signal clipping, so most equalizers typically also benefit greatly from a pre-amp, allowing you to uniformly attenuate an entire signal before equalization to avoid the clipping caused by equalization peaks.
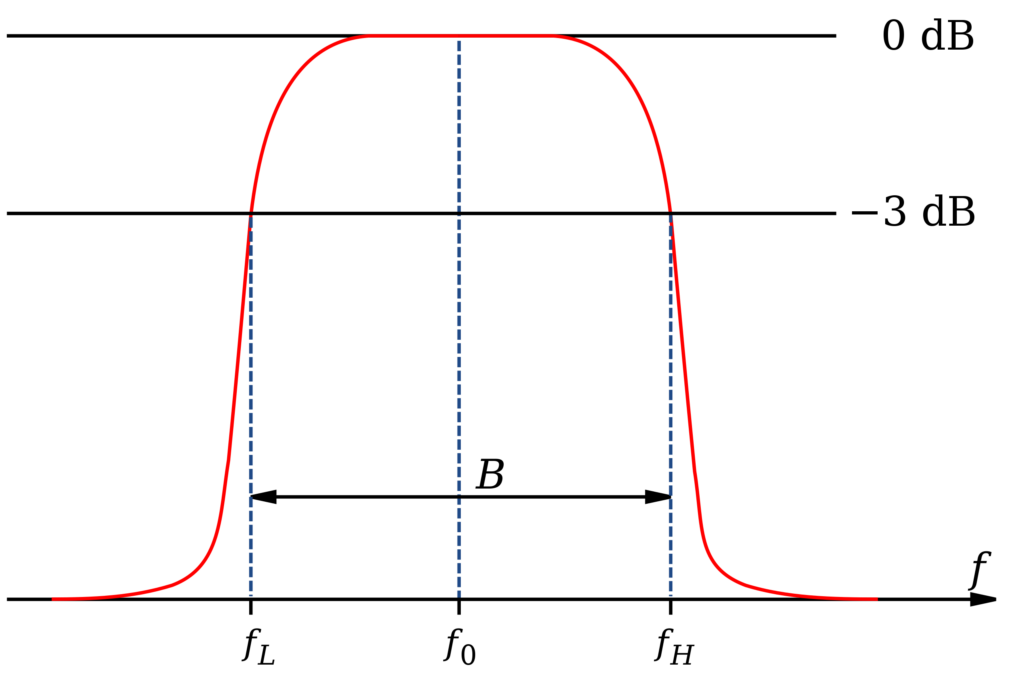
Equalizers are typically implemented using linear filters; most commonly band-pass filters and peaking filters. Analog equalizers are commonly implemented as band-pass filters connected in parallel, while DSP equalizers are commonly implemented as peaking filters connected in series.
 |
A band-pass filter is typically made using a cascade of a high- and low-pass filter (such as an RLC circuit), and allows only a single band (a range of frequencies) to pass through, while virtually attenuating everything else.
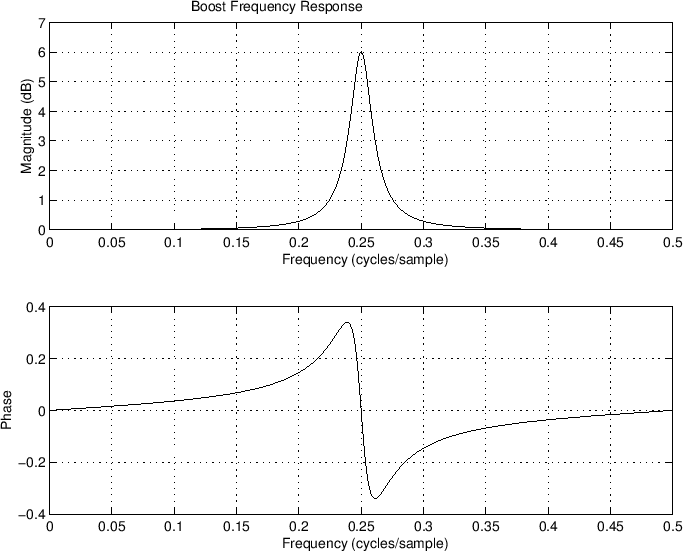
A peaking filter is typically implemented as a DSP filter, and it provides unity gain everywhere except for an amplification or attenuation of a bell-shaped band.
AutoEQ
But how exactly do we precisely equalize to the Harman target?
You typically can’t, at least not without a measurement rig for feedback tuning, as well as a driver that’s actually physically able to conform to the exact demands. But you can very well approximate it.
In theory, it is possible to calculate the equalization settings required to bring a source curve to a target curve. The legendary AutoEQ project by jaakkopasanen does exactly that, backed by raw frequency response data from various online databases (covering thousands of headphones).
The repository comes not only with pre-built results (usually targeting a variation of Harman Curve), but also scripts, tools and normalized raw data to generate your own.
To shift the sound signature of your headphones towards the Harman Curve, simply install a system-wide equalizer in your chosen platform (or use your player’s built-in equalizer) and apply the appropriate results for your headphone model.
TLDR
“I have an Android phone, and I have a Sony WH-1000XM4. What do I do?”
- Download a good equalizer like Poweramp Equalizer.
- Use the following settings:
- Equalizer Mode: Parametric mode
- Bands Overlap: Cascade
- Smooth Equalizer/Tone Gains: Off
- Find your headphone model from the results section and copy the values into the app.
Enjoy the music 😀
If the equalization doesn’t seem to be working, go into your settings page and select “Equalizer doesn’t work”. Most likely you’ll have to turn on DUMP Permission and Notification Listener Permission (follow the instructions in the Poweramp WebADB page, it will walk you through).
Many sites would recommend Wavelet, but I’m not getting the right results as of writing. Though it can automatically apply AutoEQ settings, it somewhat suffer from clipping issues no matter what I’ve tried (changing buffer size, etc.). You can try that first. I’m using a Galaxy Note 10+ (SM-N975F/DS), One UI version 4.1, Android version 12.
1 comment